Visualising track and train finances together: a new tool for operational decision-makers
A blog by John Gerrard, Lead Finance Director
24 May 2024

This is the second blog in a short series – if you haven’t already, we’d recommend reading our blog on how rail finances work today, before sinking your teeth into this latest offering!
This week, we were in Birmingham with finance leaders drawn from across track and train. Over the course of the day, we heard examples of where collaboration across the different parts of the rail system can make a positive difference to business planning, timetabling and operations – all of which are ultimately about delivering better outcomes for customers and taxpayers.
As I described in my last blog, the way rail’s fragmented finances work today don’t easily support those seeking to come together to make operational decisions about train services and the tracks they run on, as they try to do the right thing for passengers, freight customers and taxpayers.
It’s one of the big structural problems highlighted in the government's Plan for Rail.
Of course, money isn’t everything – financial sustainability is just one of the five strategic objectives rail has been given. But, as I said in my first blog, being able to easily see, the whole-industry financial picture is crucial if we’re to deliver a more sustainable financial future.
Although there are ways to understand industry finances across track and train at a macro level, tools for operational rail leaders to really drill down into the state of play at a regional or local or even line of route level of detail, didn’t really exist up until recently.
I want to take a deep dive into some of the work to tackle this problem – because we have been building new tools to help those operational decision-makers with a better, more detailed understanding of the impact that different financial choices have across the whole system.
This work has been a real cross-industry collaboration involving the Department for Transport, Network Rail, Rail Delivery Group, owning groups and train operators. And collaborating in this way has proved incredibly rewarding, because these tools are starting to provide some green shoots of clarity.
Here’s more on just one of those tools, the Industry Financial Model – what it does, how it was created and what it is beginning to unlock.
Route Sections formed our skeleton
Two years ago, Great British Railways Transition Team (GBRTT) started working with Network Rail on how to collate and present the vast amounts of publicly available financial data in as user-friendly a way as possible.
From an operational and infrastructure point of view, at the most local level, the railway is organised into “route sections” and there are around 2,000 of these. They range in size but, typically, are around a mile long and are often between two landmarks or clearly defined points like a junction, station, or signal.
But when you look at rail’s financials, money is not broken down to, or understood in, this level of local detail. It was clear, very early in this journey, that uncovering what was happening with rail’s finances at a much more granular level was a big gap and plugging it would be incredibly beneficial for decision-makers.
Choosing to focus on finding and bringing together whole-system data mapped onto route sections and using this well understood railway unit, provided the necessary skeleton to create the kind granularity needed for users to create their own ‘whole system’ picture using a single interactive tool.
Putting meat on the bones
First, the team set about allocating costs by painstakingly pouring over data from both operators and Network Rail and looking at a huge range of cost considerations, including:
- The amount of time it takes to deliver maintenance at a particular location
- The number of trains passing through particular locations
- The long-term costs of renewing individual pieces of infrastructure
With this data the team were able to allocate the costs of maintenance, signalling, operator costs and wider industry costs to specific route sections – all 2,000 of them. The size of the data model was terrifying!
The next challenge was how to allocate revenue. There are over a billion journeys made on the network each year and, obviously, a ticket attached to each of these journeys. So every ticket is analysed, along with its recorded start and end station as well as the revenue associated with these journeys.
From there, a clever piece of coding produces a model which determines what the most likely route from A to B would be for every individual ticket purchased. This allowed us to spread the price of that ticket evenly across all the route sections on which they travelled. Every single one of them!
It would have been a lot easier (and quicker) to simply allocate the revenue to the station where the journey started, but this would be inconsistent with the way costs are incurred across the network.
Here, I should add that there are other ways to allocate costs and indeed revenues – we are not saying this is the only way! But we have worked hard with industry colleagues to try to create a broad consensus on some reasonable criteria, and to start to develop those cross-industry financial discussions based on a consistent data set.
From terrifying datasets to useable tools
From the outset, it was important to create tools that were as user-friendly and accessible as possible. At this point, the enormous datasets I just described didn’t quite meet that bar!
There were two parts to this challenge. How might the data be visualised so that it’s easy to navigate? And how might we simplify some pretty complex, technical language, removing as much of the jargon as possible?
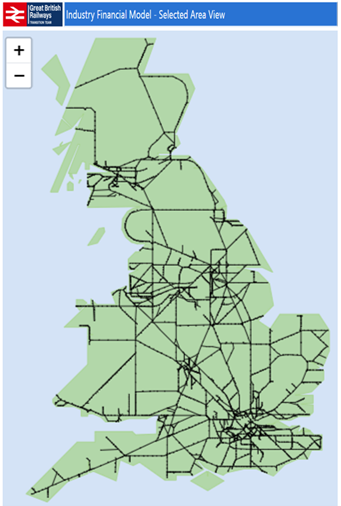
Using PowerBI, we were able to create a new interactive tool – the Industry Financial Model (IFM for short) – which allows the user to interrogate the data and use it as a new lens to inform decision making. The tool visualises the whole of the network, with costs and revenue sat side by side and broken down to the most local level possible (the c.2,000 route sections).
The information all existed before, and various parts of industry could access their own parts, but it hasn’t been brought together and presented in an easily accessible way until now.
Users can now draw up a P&L for both traditional and non-traditional railway geographies. For instance, maps of rural areas or cities, counties or mayoral regions or lines of route, such as London to Stevenage, Ipswich to Chelmsford or Cleethorpes to Barnetby.
All by clicking through on a line of route in the model below:
In addition to financial information, the model includes non-financial Key Performance Indicators (KPIs), e.g. train punctuality, used asset life, and passenger journeys. Further financial information and non-financial KPIs will be added as the model continues to develop to support insight that leaders can act upon.
For instance, we recently added detailed visuals of Network Rail’s forward Control Period 7 (CP7) renewals portfolio at a project-by-project level against each line of route. This allows users to make better, more informed, ‘whole system’ decisions by triangulating both financial AND non financial information e.g. revenue intensity, asset condition detail, train performance and forward investment.
This new approach is already providing an exciting and fruitful new lens to support NR’s ‘market-led’ approach to CP7 planning.
What’s next?
The tool is currently being trialled with a range of industry stakeholders, to get their feedback on how it can be both implemented in its current form, as well as improved to make it more useful in supporting better whole-system decisions.
No single tool can answer all the financial questions on the railway, so other, complementary tools and strategies will need to be (and indeed are being) developed by industry colleagues. It’s an exciting moment as the rail industry finance community is coming together to support leaders across the sector with high quality whole industry tools and insight.
The Industry Finance Model provides transparency of data that we have not had in one place before, allowing colleagues to ask questions that can impact their local railway rather than just the elements their organisation works across. Through sharing among industry teams, the tool is helping upskill rail colleagues to work successfully in an integrated railway.
The team are also looking at how finance colleagues can be leaders of great data and analysis, with training and support for future technological tools. With the ever-increasing use of Artificial Intelligence, our profession will need to keep pace to ensure that the tools are useful in providing strategy input through business partnering.
We will continue to get in touch with people and teams across industry who would like to see the model and how it works. We’d love it if people reached out to us by emailing comms@gbrtt.co.uk – colleagues will ensure your message reaches us.